Line balancing uses live production data to find your bottleneck, test millions of ways to redistribute work, and recommend the rebalance that gets the most out of the line you already have.
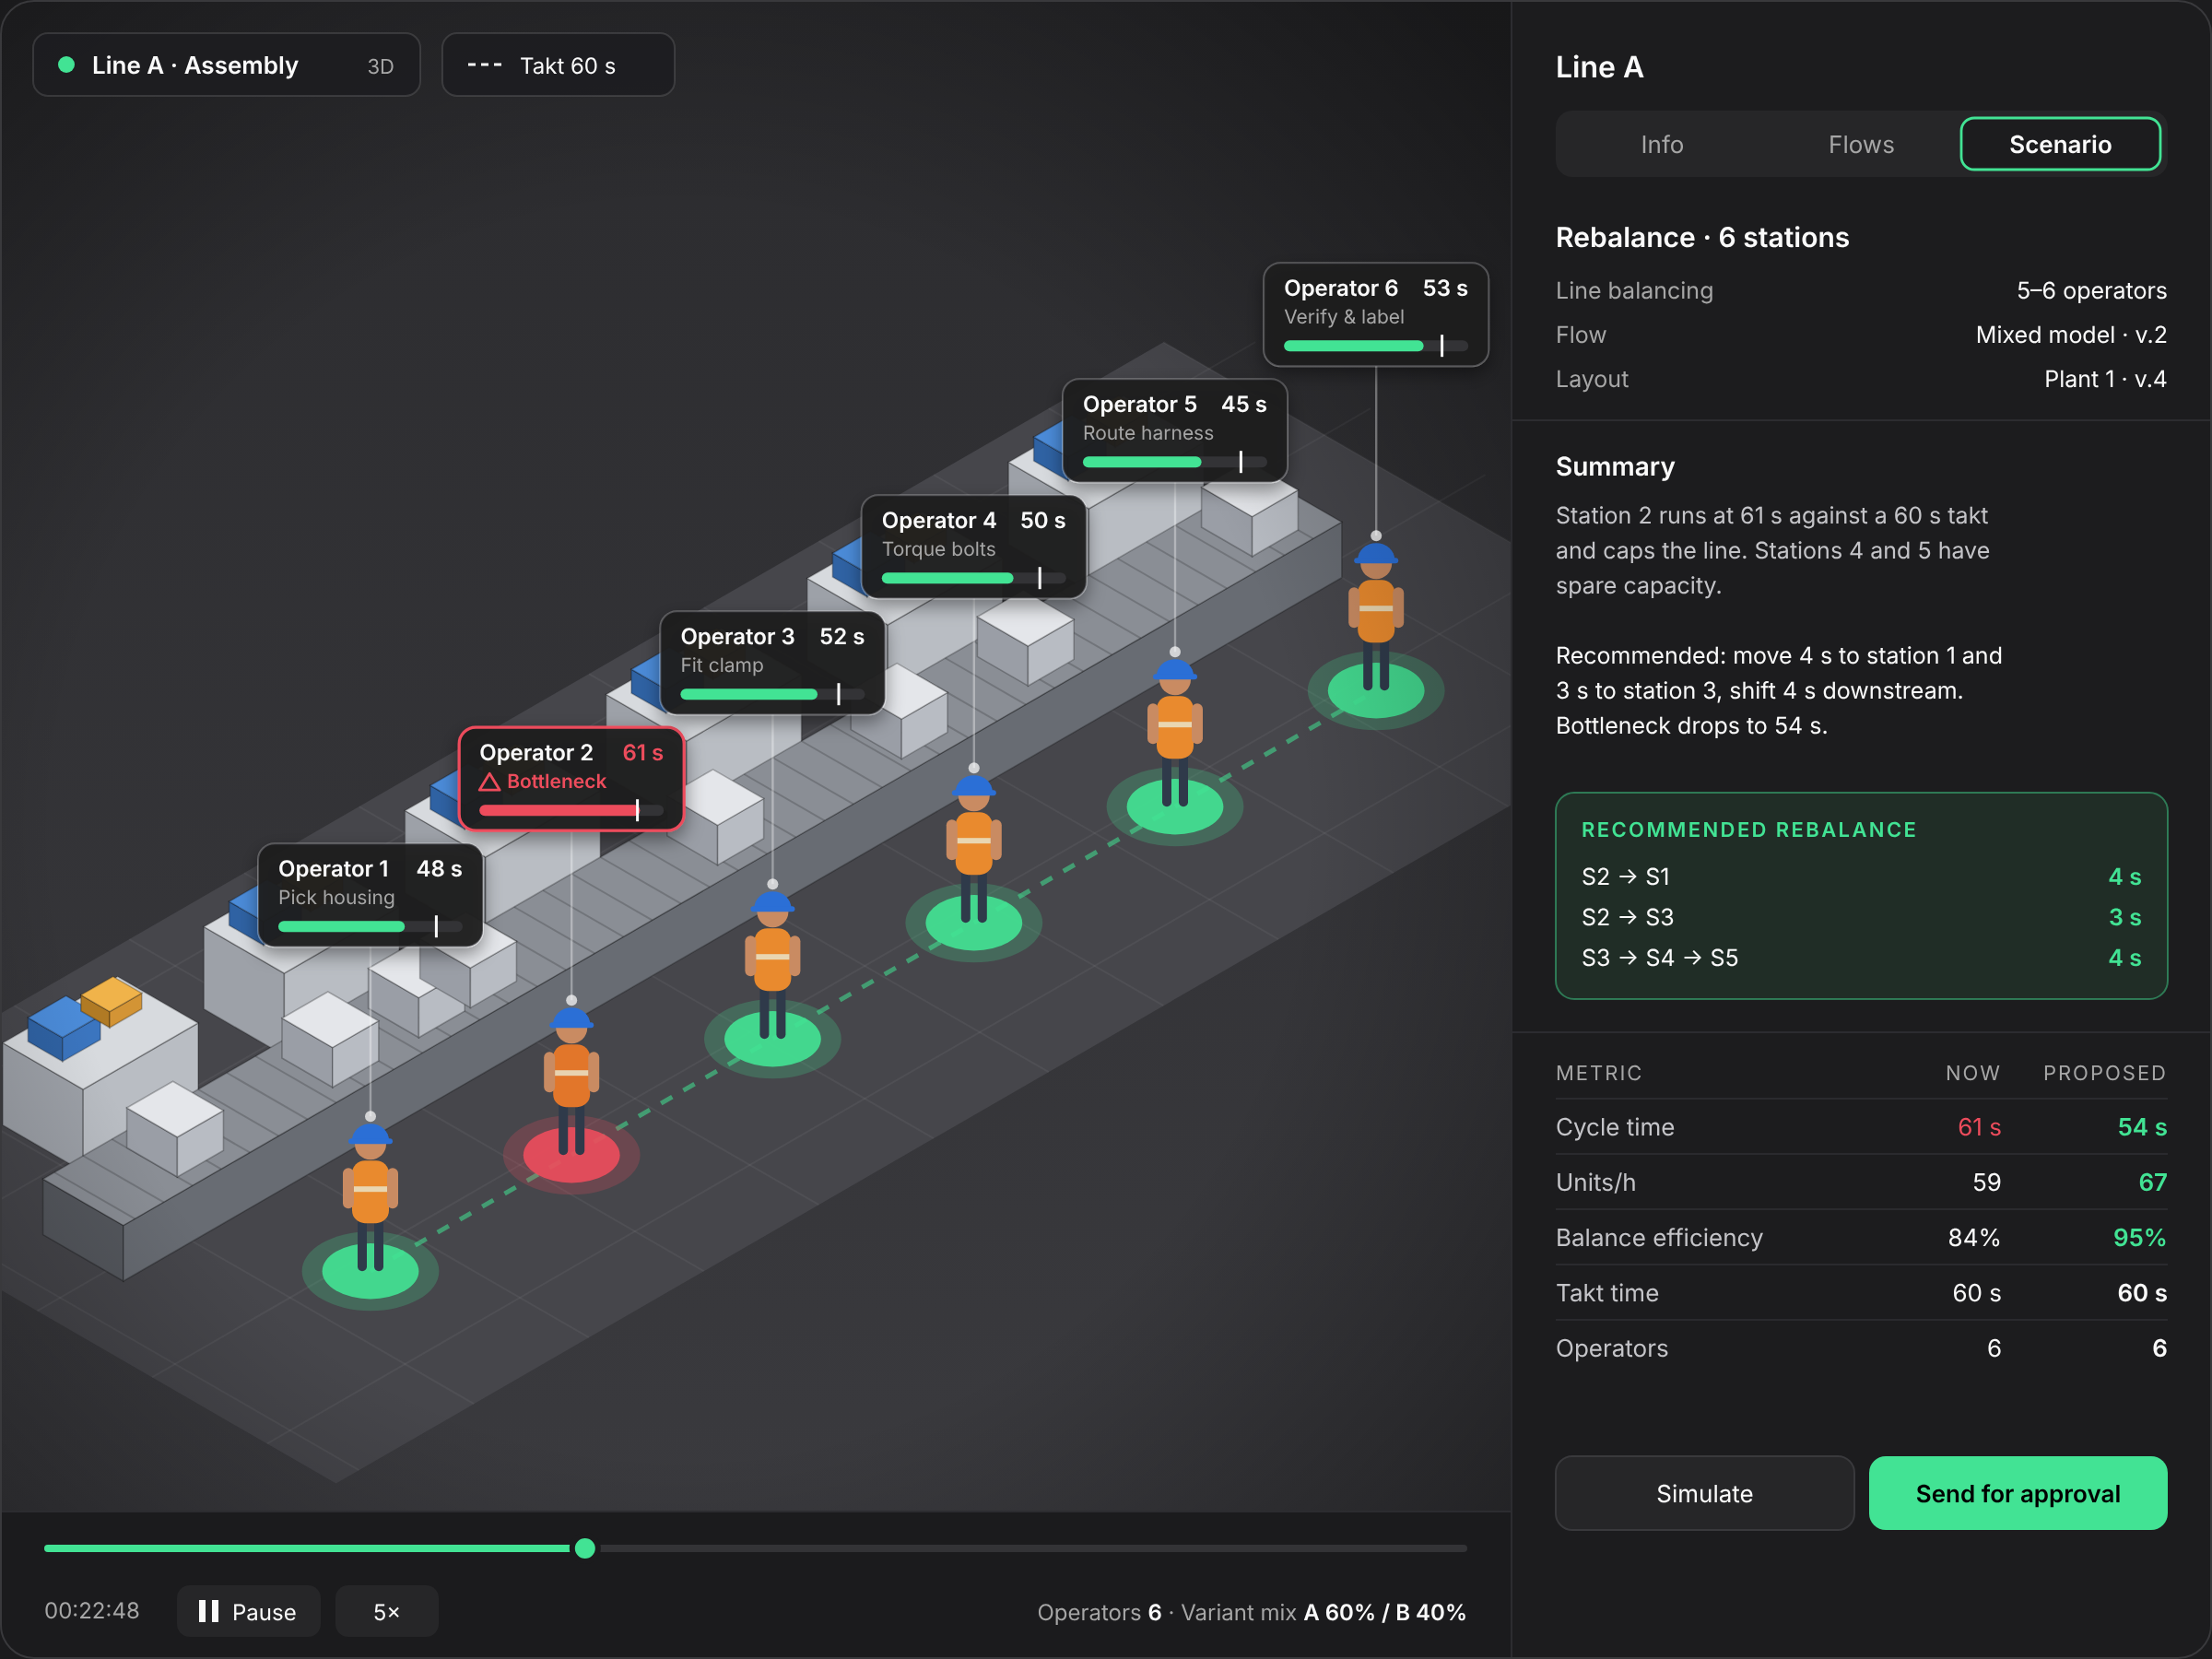
Flagged bottleneck, per-station load and the solver's recommended rebalance.
Most lines are balanced well exactly once: at launch. After that, product mix, operator skills, micro-stops and engineering changes shift work between stations. One station creeps past takt, the whole line slows to its pace, and the others wait.
Rebalancing by hand takes weeks or days of time studies and spreadsheets, so most lines run with the bottleneck until the next kaizen event.
“Where is the current bottleneck, and what happens if we move it?”
“How does a new product variant change the balance?”
“What's the fastest this line can run with four operators?”
Six stations, 309 seconds of work, takt 60 seconds. Before: station 2 runs at 61 s and caps the line (84% balance efficiency). After: the bottleneck drops to 54 s (95% efficiency), giving about 13% more output with the same people and equipment.
Respects task order, zoning and fixed-station constraints.
Balances across variants and real product mix, not just the average model.
Re-plan in minutes for new demand, shift patterns or headcount.
Test every move before it touches the line.
We pull task times, task order, variants, staffing and demand from MES, ERP, PLCs and time studies. Your systems stay as they are.
The solver tests millions of ways to assign tasks to stations against takt, precedence, mix, skills and ergonomics. The best options are simulated against real variation.
Your engineers review ranked proposals, adjust them and approve. Nothing changes on the line without that sign-off.
Line balancing is a module on the Epicz platform. Connections set up for it are reused by every other module.
For a single-model line with stable demand, a spreadsheet may be enough. The more variants, mix changes and lines you run, the faster a static balance decays.
“Epicz Line Balancing turns a time-consuming exercise into continuous optimization, allowing for rapidly identifying optimal configurations, uncovering scenarios teams may not have considered, and continuously improving performance on every line.”
Tier-1 automotive supplier
An 8-week pilot on a single line, measured against KPIs we agree up front: output per hour, idle time and balance efficiency. Clear go/no-go at week 8.
Connect data, map tasks and measure today's balance.
Simulate scenarios and deliver a ranked rebalance plan with your engineers.
Implement on the line and measure the result.
No. We connect to MES, ERP and PLCs and read the data we need. Your systems stay as they are.
Yes. We baseline with what you have and refine the times with live line data during the pilot.
Yes. It balances across variants and your real product mix, not just an average model.
Your engineers. Every proposal is simulated and explained, and nothing is rolled out without their approval.
A ranked rebalance plan within the first five weeks of a pilot, and a measured result by week 8.
Fixed-price pilot; contact us.
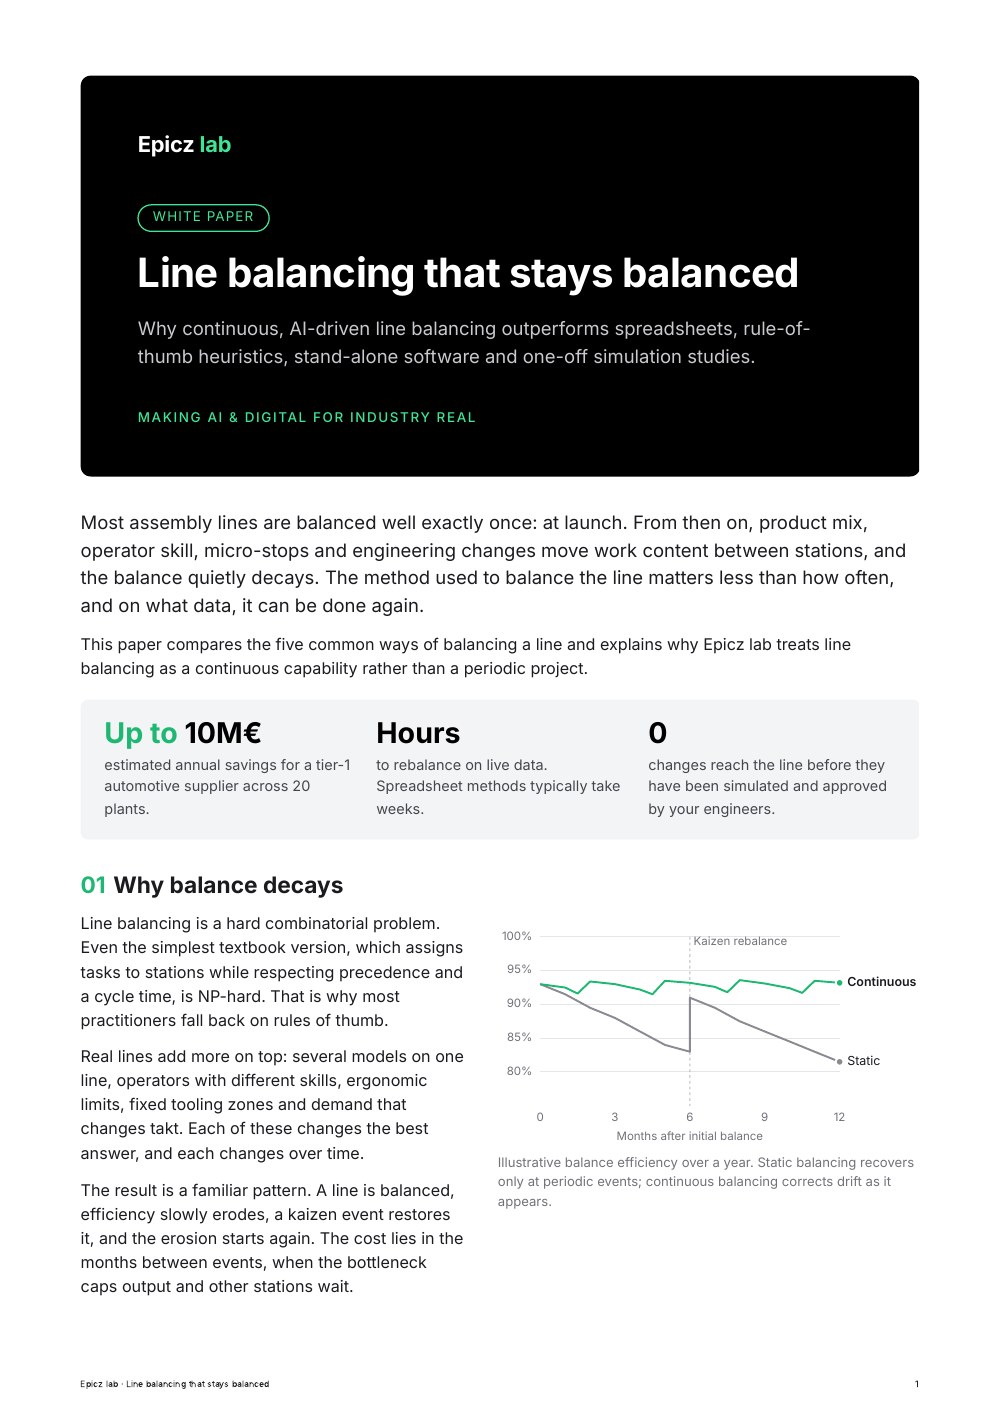
White paper
Why continuous, AI-driven line balancing outperforms spreadsheets, rule-of-thumb methods and one-off simulation studies.
Something went wrong. Please check your email address and try again.

 Log in


